
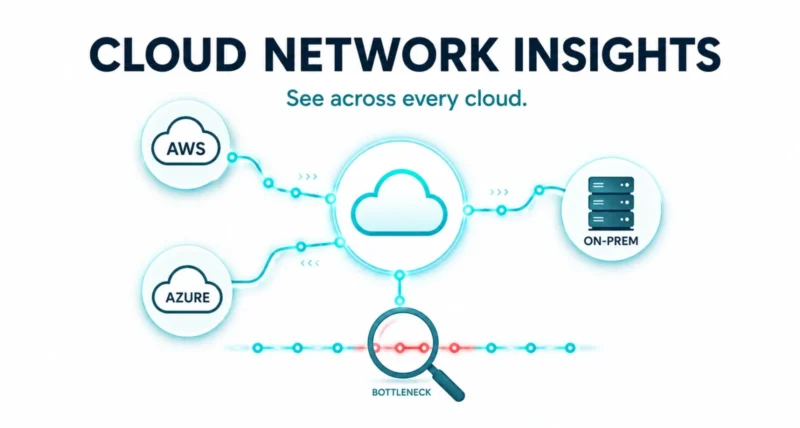
Every network engineer knows the dread of that one question when an app slows down: is it the network, the app, or something else? When your traffic crosses Google Cloud, AWS, Azure, the open internet, and your own data center, the answer can take hours to find. As Google Cloud announced, a new tool called Cloud Network Insights is built to answer it in seconds. Here is what it does and how it works.
| Quick Answer Cloud Network Insights is a new, generally available Google Cloud tool that gives you end-to-end visibility across multi-cloud and hybrid networks, including Google Cloud, AWS, Azure, and on-prem. Built with Broadcom AppNeta, it uses active synthetic probing to watch network paths around the clock, even with no live user traffic, so you can spot and pinpoint slowdowns before customers feel them. It plugs straight into Google Cloud Observability and Gemini Cloud Assist. |
The Problem: Too Many Networks, Not Enough Visibility
Modern apps do not live in one place. Your traffic might start in Google Cloud, cross the public internet, pass through an internet provider, and end up in AWS or your own data center. That flexibility is great, until something breaks.
When performance drops, the painful part is not fixing it, it is finding it. The slowdown could be anywhere along that chain. Most monitoring tools only see their own slice. The result is a finger-pointing exercise while customers wait.
| Why It Matters This is the classic blind spot in cross-cloud setups. You can see inside your own cloud, but the moment traffic leaves it, you are guessing. Cloud Network Insights is built to remove that guesswork. |
What Is Cloud Network Insights
In simple terms, it is observability for your whole network, not just the parts Google runs. Observability means being able to see what is happening inside a system from the outside. That is what lets you understand and fix it.
The tool is offered in partnership with Broadcom AppNeta, and it extends your view beyond Google Cloud to your entire global setup. It plugs into the Google Cloud Observability tools you already use, so it is not one more separate dashboard to babysit.
| Quick Take The headline trick is active synthetic probing. Instead of waiting for real users to hit a problem, the tool sends its own test traffic along your routes 24/7. So it catches trouble even at 3 a.m. when nobody is online. You fix issues before they reach anyone. |
How It Works in Three Pieces
Under the hood, the system is refreshingly simple. It comes down to three parts working together.
- Monitoring Points. You drop lightweight software agents into key spots like a central VPC, a branch office, or an on-prem data center. They run as containers or virtual machines.
- Synthetic probes. Those agents send small, frequent bursts of test traffic that mimic a real user or app. They run around the clock, whether or not anyone is actually using the network.
- Data synchronization. The agents stream that performance data to a central service. From there, metrics feed into Cloud Monitoring and alerts into Cloud Logging.
That is the whole loop: deploy a few agents, let them probe your routes constantly, and watch the results land in tools you already know.
The Two Things It Watches
Cloud Network Insights covers two layers of the experience, which together tell you whether a problem is the pipes or the app.
Network Performance (Layers 3 and 4)
This is the plumbing. It gives you a hop-by-hop view of the path between two points. It tracks round-trip time, packet loss, jitter, and path changes. There are two modes.
- Single-ended mode probes an external target like a URL or IP that has no agent installed, handy for things you do not control.
- Dual-ended mode probes from one Monitoring Point to another, giving richer data like one-way latency and the ability to spot asymmetric routing, where traffic takes a different path back than it took out.
Digital Experience (Layer 7)
This is what the user actually feels. It watches your web apps and answers a key question: is the slowdown the network or the app itself? Again, two modes.
- Browser mode uses a real browser engine to load full pages, run JavaScript, and measure true page-load times, the real user experience.
- HTTP mode sends lightweight requests to check availability, response time, and DNS or TLS performance.
| The Standout Because it watches both the network layer and the app layer, Cloud Network Insights can finally settle the old argument. It tells you whether the slowdown is the network, the app, or the browser. No more team-versus-team guesswork. |
The Smart Part: Alerts and AI
Raw data is only useful if it tells you something. This is where the tool gets genuinely helpful.
- Proactive alarms learn your normal performance automatically, then alert you through email, Slack, or PagerDuty the moment something drifts out of range.
- Monitoring policies let you automate setup at scale, creating or removing monitored paths based on tags, so you are not configuring everything by hand.
- Root-cause analysis pinpoints whether a slowdown is inside Google Cloud, at the ISP, or over in AWS or Azure, the part that usually eats hours.
The headline feature is AI. Through Gemini Cloud Assist, you can ask questions in plain language instead of hopping between dashboards. Ask Gemini to cross-reference your network metrics against other data. It helps cut your mean time to resolution, the time it takes to actually fix a problem.
What It Does for You, at a Glance
| Capability | What You Get |
| End-to-end path visibility | Hop-by-hop view with RTT, packet loss, and jitter, even on networks you do not run |
| Digital experience insights | DNS, HTTP codes, and full page-load times to separate network from app issues |
| Proactive alerting | Synthetic tests catch dips before customers do, via email, Slack, or PagerDuty |
| SLA checks | Hard data to confirm whether your ISPs are meeting their promises |
| Rapid root-cause analysis | Quickly tell network, app, and browser problems apart |
| AI-driven insights | Ask Gemini Cloud Assist questions in plain language to resolve issues faster |
Who It Is For
If you run anything across more than one cloud, this is aimed squarely at you. The best-fit teams include:
- Network and DevOps engineers tired of the cross-cloud blame game when something slows down.
- Platform and SRE teams who need to catch problems before they page someone at 2 a.m.
- IT leaders who want to hold ISPs and providers accountable to their SLAs with real data.
Google says early users like Sabre and Pexip are already using it to bring clarity to their hybrid setups. Sabre calls total visibility a requirement for operational resilience, not a luxury.
Cloud Network Insights tackles one of the most frustrating problems in modern IT: when an app slows down across a tangle of clouds, where is the actual bottleneck? It probes your routes around the clock and watches both the network and the app. That turns hours of finger-pointing into a quick, clear answer. For any team running across multiple clouds, it is a strong addition to the toolkit. You can read the full announcement and start in the console on the Google Cloud blog.
Frequently Asked Questions
What Is Cloud Network Insights
It is a Google Cloud tool, now generally available. It gives end-to-end visibility into network and app performance across multi-cloud and hybrid environments, including Google Cloud, AWS, Azure, and on-prem.
What Is Synthetic Probing
Synthetic probing means sending small bursts of test traffic that mimic a real user. This lets the tool measure performance 24/7, even when no real users are on the network.
How Is It Different From Normal Monitoring
Most tools only see their own cloud. Cloud Network Insights watches the whole path, including parts you do not control like ISPs and other clouds. So it can pinpoint exactly where a slowdown happens.
Does It Work With AWS and Azure
Yes. It is built for cross-cloud and hybrid setups, giving you one view across Google Cloud, AWS, Azure, on-prem data centers, and internet-facing apps.
What Does It Integrate With
It plugs into Google Cloud Observability, namely Cloud Monitoring and Cloud Logging. It also supports OpenTelemetry, sends alerts to email, Slack, or PagerDuty, and connects to Gemini Cloud Assist for AI-driven analysis.
How Do I Get Started
You can start in the Google Cloud console and deploy Monitoring Points as containers or virtual machines. Google’s product docs walk through setup and policies.

