
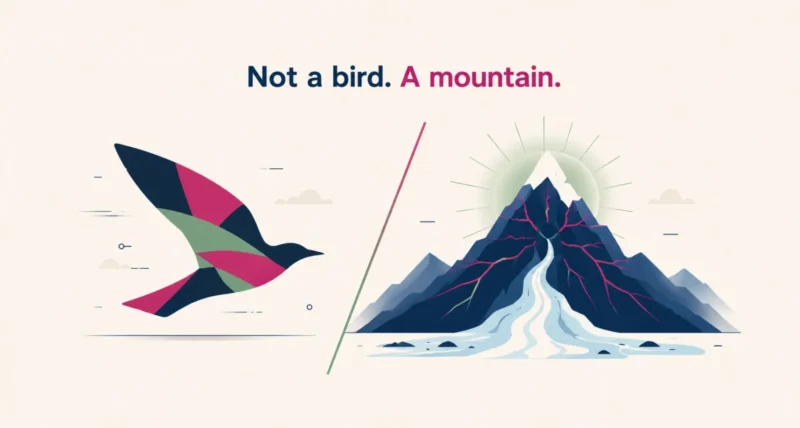
A satellite pointed at East Antarctica and sent back what looks unmistakably like a hummingbird in magenta and green. There are no hummingbirds in Antarctica, and there is no bird in the image either.
The NISAR hummingbird Antarctica image is a mountain, a moving glacier, and a set of deep cracks in the ice. Every color in it means something specific, and once you know the code you can read the picture yourself. The genuinely useful part is at the end: this data went public four days ago, and anyone can download it.
| The Short Answer The bird is a coincidence. Its dark body is a mountaintop in East Antarctica called Nunatak Zaterjavshijsja. The tail is a stream of ice flowing northeast toward the ocean, and the splayed feathers are crevasses, deep cracks torn open as the glacier grinds past the mountain. The colors are not decoration: magenta marks smooth ice, green marks fractured ice, and white marks a mix of both. The image came from the NASA-ISRO NISAR satellite, whose radar data became publicly available on July 20, 2026. |
What Each Part of the Bird Actually Is
Start with the anatomy, because the shape decodes cleanly once you know what you are looking at.
| What It Looks Like | What It Actually Is |
| The dark body at the center | Nunatak Zaterjavshijsja, a mountaintop in East Antarctica |
| The long tail | A stream of ice flowing northeast toward the ocean |
| The splayed feathers | Crevasses, deep cracks in the ice around the mountain |
| The overall bird shape | Pure coincidence of geology and glacier physics |
The mechanism behind the feathers is the interesting part. A nunatak is a mountain peak that pokes up through an ice sheet, and this one sits directly in the path of a moving glacier. As the ice flows past the obstruction, the mountain’s shape puts the surrounding ice under stress, and the ice answers by cracking. Those fractures radiate outward from the peak, which is precisely why they look like plumage.
How to Read the Colors
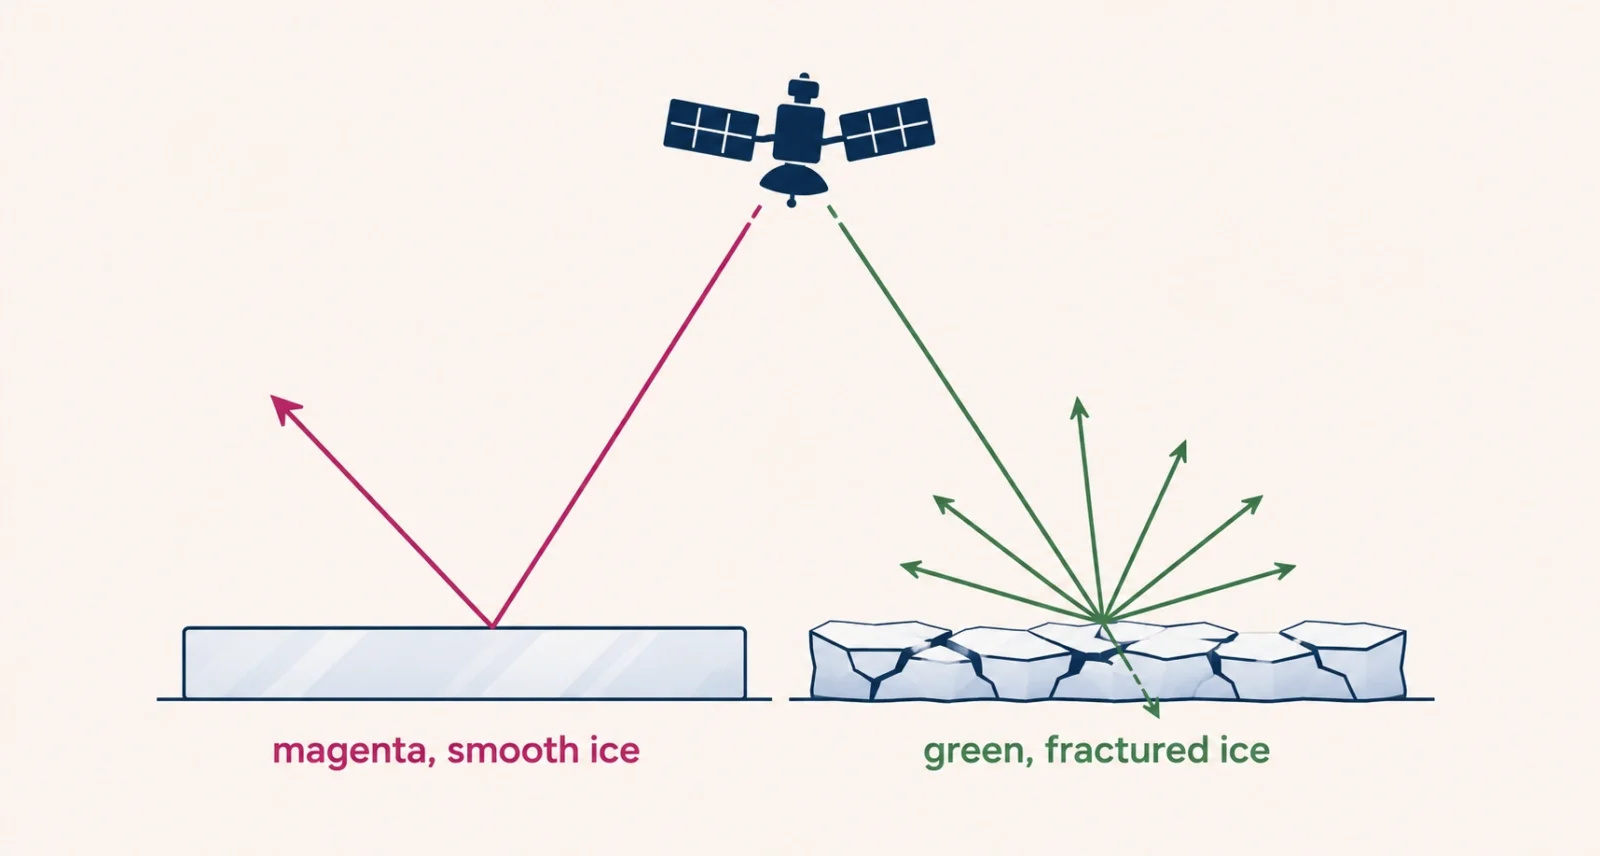
This is where the image stops being a curiosity and becomes a scientific instrument. NISAR sends radar waves down at Antarctica with a horizontal wobble, and what comes back tells you what the surface is made of.
| Color | What Came Back | What It Means on the Ground |
| Magenta | Horizontal signal, same as it went out | Smooth, regular surfaces such as flat ice |
| Green | Vertical signal, or scattered at angles | Irregular surfaces, or signal that went into the ice |
| White | Both strongly at once | A roughly equal mix of smooth and fractured |
Green is the one worth understanding properly. Scientists call it volume scattering, and it happens when the radar does not simply bounce off the top. The signal partly penetrates the snow and ice, or hits the angled faces of a crevasse and scatters. Green therefore does not mean green ice. It means broken, layered, or textured ice, which is exactly what surrounds a mountain that a glacier is grinding past.
| Quick Take Read the picture as a map of roughness rather than a photograph. Smooth reflects straight back and shows magenta. Rough scatters and shows green. Once that clicks, you are not looking at art any more, you are looking at a map of where Antarctic ice is intact and where it is tearing apart. |
Why Radar Sees What a Camera Cannot
Photograph the same spot in ordinary light and you get an almost entirely white rectangle. Snow, ice, a faint shadow near the peak, and very little else.
Radar works differently because microwaves pass into frozen surfaces instead of stopping at them. That is the whole advantage. As NASA’s Jet Propulsion Laboratory explains, radar can see through snow and deep into ice, letting NISAR measure properties of Antarctic ice that optical imagery simply cannot record. Seongsu Jeong, the JPL engineer who produced the image, put it neatly: “With NISAR we’re seeing what’s hidden beneath the surface.”
One detail people miss: this image was not taken recently. The measurements came from August 2025, while the mission teams were still testing the satellite’s systems.
What NISAR Is, in One Section
NISAR stands for NASA-ISRO Synthetic Aperture Radar, a joint mission between the American and Indian space agencies. The specifications explain why it can do this.
| Detail | The Number |
| Launched | July 30, 2025, from India’s Satish Dhawan Space Centre |
| Radar instruments | Two, L-band and S-band, a first for a free-flying mission |
| Antenna reflector | 39 feet, or 12 meters, the largest NASA has flown |
| Coverage | Nearly all land and ice on Earth, twice every 12 days |
| Data produced | Dozens of terabytes per day |
| Range | Near the South Pole up to 77.5 degrees north |
Notice that the two-radar design matters more than it sounds. The longer L-band waves pass through tree canopies to image the ground underneath, while S-band can observe the canopy itself. JPL leads the American side and supplied the L-band radar and the reflector. ISRO supplied the spacecraft body and the S-band radar.
The Real News: Anyone Can Now Download This Data
The bird made the headlines. The data release underneath it is the part that actually changes something.
On July 20, 2026, the mission began publishing its radar data publicly on an ongoing basis. Researchers, students, and anyone curious can now use it. The data tracks moving land and ice, monitors forests and wetlands, and helps study hazards such as landslides and earthquakes. Two portals hold it.
- L-band data from the American side downloads through the Alaska Satellite Facility archive in Fairbanks, which hosts all NASA synthetic aperture radar data.
- S-band data from the Indian side comes from ISRO’s Space Applications Centre in Ahmedabad, released through the Bhoonidhi portal.
- For background on the mission before you dig in, NASA keeps an official NISAR mission page.
| Worth Knowing The American team is currently publishing calibrated L-band measurements collected since June 17, and expects to release everything gathered earlier in the mission by the end of the year. So the archive will keep growing. If you look now and your area of interest is missing, it is worth checking again in a few months rather than concluding the data does not exist. |
The hummingbird is a happy accident, and there is nothing wrong with enjoying it. What sits underneath is more interesting. Every color in it is a measurement, showing exactly where Antarctic ice holds together and where a glacier pulls it apart.
Frequently Asked Questions
Is there really a hummingbird in Antarctica?
No. Antarctica has no hummingbirds, and the image contains no bird at all. The shape is a coincidence. It comes from a mountaintop called Nunatak Zaterjavshijsja, a glacier flowing past it toward the ocean, and the deep cracks the moving ice tears open around the peak. The resemblance is pure chance.
What do the magenta and green colors mean?
They show how radar signals bounced back. Magenta means the signal returned with the same horizontal orientation it was sent with, which indicates a smooth, regular surface such as flat ice. Green means the signal returned vertically or scattered at angles. That indicates irregular surfaces like crevasse walls, or signal that penetrated into the ice. White means both occurred strongly.
What is a nunatak?
A nunatak is a mountain peak or rocky outcrop rising above a surrounding ice sheet or glacier. The word comes from Greenlandic. A nunatak blocks flowing ice, which creates stress in the glacier moving around it. That stress produced the radiating crevasses that look like feathers here.
What is the NISAR satellite?
NISAR is the NASA-ISRO Synthetic Aperture Radar satellite, a joint American and Indian mission. It launched on July 30, 2025 from Satish Dhawan Space Centre. This was the first free-flying mission to carry two radar instruments, an L-band and an S-band. Between them they image nearly all of Earth’s land and ice surfaces twice every 12 days.
Why use radar instead of a normal camera?
Microwaves penetrate frozen surfaces, while visible light stops at them. Photograph the same Antarctic scene in ordinary light and it appears almost entirely white, with only faint shadows hinting at the mountain. Radar reveals the structure of the ice below, including fracturing that no optical image would capture, and it works through cloud and darkness.
Can I access NISAR data myself?
Yes, since July 20, 2026. The Alaska Satellite Facility archive in Fairbanks distributes the L-band data from the American side. ISRO’s Bhoonidhi portal carries the S-band data from the Indian side. Releases are ongoing, with data gathered earlier in the mission expected to become available by the end of the year.

